 Image credit: Unsplash
Sentiment Analysis on Earnings Call Transcript
Earning call is a conference call between executives and major investors where they discuss their quarterly financial performance and future outlook. It is usually held quarterly by most publicly traded corporations. These calls provide valuable insight to investors and analysts to make trading decisions. However, listening an earnings call is a time consuming process. What if the overall sentiment score of an earnings call could be determined in order to get an idea of the company’s future outlook?
This article will show the sentiment analysis on the earnings call, visualize the points for analysts or investors to make trading decisions.
Getting Transcripts Data
To get data for sentiment analysis, I manually scraped earnings call transcripts from here. You can also subscribe to APIS that give call transcripts and use that data to apply sentiment analysis.
Load Data
We have the transcript text, now we will load that into dataframe for further processing:
transcript = """
Operator: Good day, everyone. Welcome to the Apple Incorporated Third Quarter Fiscal Year 2020 Earnings Conference Call.
    Today's call is being recorded. At this time, for opening remarks and introductions, .......
"""
# split the transcript into sentences
sentences = [' '.join(sent.split()).strip() for sent in transcript.replace('\n', '').split('. ')]

# convert to dataframe
df = pd.DataFrame(sentences, columns=['content'])
Apply Sentiment Analysis
Now, we have to perform necessary steps to get sentiment of the data, We will use NLTK stands for Natural Language ToolKit. It is a library that helps us to manage and analyse languages.
Clean and Prepare for Sentiment Analysis
The first step in any NLP task is text preprocessing: removing noise and correctly formatting the text for use by your models. Below are the text preprocessing measures that we will take on the earnings call transcripts:
- Lowercase - Convert all words to lowercase to avoid storing both uppercase and lowercase forms of the same word.
- Tokenization - Convert the sentences into tokens.
- Punctuation - Remove all punctuations to avoid multiple representations of the same word.
- Stop Words - Common words which should be ignored, such as “a”, “an”, and “the”.
- Lemmatization - Removing inflection to reduce words down to their “dictionary form”.
Here is the code that we can use to preprocess the text before applying sentiment analysis:
import string
from nltk import pos_tag
from nltk.corpus import wordnet
from nltk.corpus import stopwords
from nltk.stem import WordNetLemmatizer

# return the wordnet object value corresponding to the POS tag
def get_wordnet_pos(pos_tag):
    if pos_tag.startswith('J'):
        return wordnet.ADJ
    elif pos_tag.startswith('V'):
        return wordnet.VERB
    elif pos_tag.startswith('N'):
        return wordnet.NOUN
    elif pos_tag.startswith('R'):
        return wordnet.ADV
    else:
        return wordnet.NOUN

# return the cleaned text
def clean_text(text, digits=False, stop_words=False, lemmatize=False, only_noun=False):
    # lower text
    text = str(text).lower()

    # tokenize text and remove puncutation
    text = [word.strip(string.punctuation) for word in text.split(" ")]

    # remove words that contain numbers
    if digits:
        text = [word for word in text if not any(c.isdigit() for c in word)]

    # remove stop words
    if stop_words:
        stop = stopwords.words('english')
        text = [x for x in text if x not in stop]

    # remove empty tokens
    text = [t for t in text if len(t) > 0]

    # pos tag text
    if lemmatize:
        pos_tags = pos_tag(text)
        # lemmatize text
        text = [WordNetLemmatizer().lemmatize(t[0], get_wordnet_pos(t[1])) for t in pos_tags]

    if only_noun:
        # select only nouns
        is_noun = lambda pos: pos[:2] == 'NN'
        text = [word for (word, pos) in pos_tag(text) if is_noun(pos)]

    # remove words with only one letter
    text = [t for t in text if len(t) > 1]

    # join all
    text = " ".join(text)

    return(text)
We will use apply function to apply clean_text over each row of dataframe as per below:
# clean text data
df['content_clean'] = df['content'].apply(lambda x: clean_text(x, digits=True, stop_words=True, lemmatize=True))
Now we have cleaned text in content_clean column, our next task is to apply sentiment analysis.
Sentiment Intensity Analyser
Here, We will use the Sentiment Intensity Analyser which uses the VADER Lexicon. VADER is a rule-based sentiment analysis tool. VADER calculates text emotions and determines whether the text is positive, neutral or, negative. This analyzer calculates text sentiment and produces four different classes of output scores: positive, negative, neutral, and compound.
# import NLTK library for importing the SentimentIntensityAnalyzer
from nltk.sentiment.vader import SentimentIntensityAnalyzer

# create the instance of SentimentIntensityAnalyzer
sid = SentimentIntensityAnalyzer()

# get sentiment score for each category
df['sentiment']= df['content_clean'].apply(lambda x: sid.polarity_scores(x))
df = pd.concat([df.drop(['sentiment'], axis=1), df['sentiment'].apply(pd.Series)], axis=1)
df = df.rename(columns={'neu': 'neutral', 'neg': 'negative', 'pos': 'positive'})

# add sentiment based on max score
df['confidence'] = df[["negative", "neutral", "positive"]].max(axis=1)
df['sentiment'] = df[["negative", "neutral", "positive"]].idxmax(axis=1)
We dit it! Look at the output below for the steps performed so far…

Now in next section we will visualizing the results obtained by performing sentiment analysis to get more insights out of the data.
Insights
We have sentiments data for sentences from the earnings call, let us get more insights out of it.
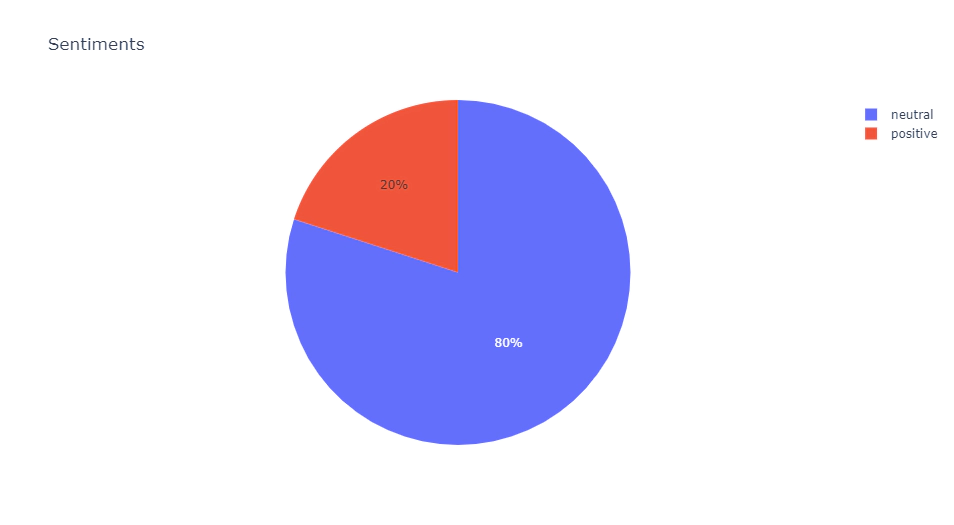
Display percentage of positive, negative and neutral sentiments
Let us understand the amount of positive, neutral, or negative sentiments that are involved in the sentences from the earnings call of the data. For visualizing the results, we will use plotly python package:
import plotly.express as px
import plotly.graph_objects as go

# create data for plot
grouped = pd.DataFrame(df['sentiment'].value_counts()).reset_index()
grouped.columns = ['sentiment', 'count']

# Display percentage of positive, negative and neutral sentiments
fig = px.pie(grouped, values='count', names='sentiment', title='Sentiments')
fig.show()
And this plot will show you what is the percentage of each sentiments:

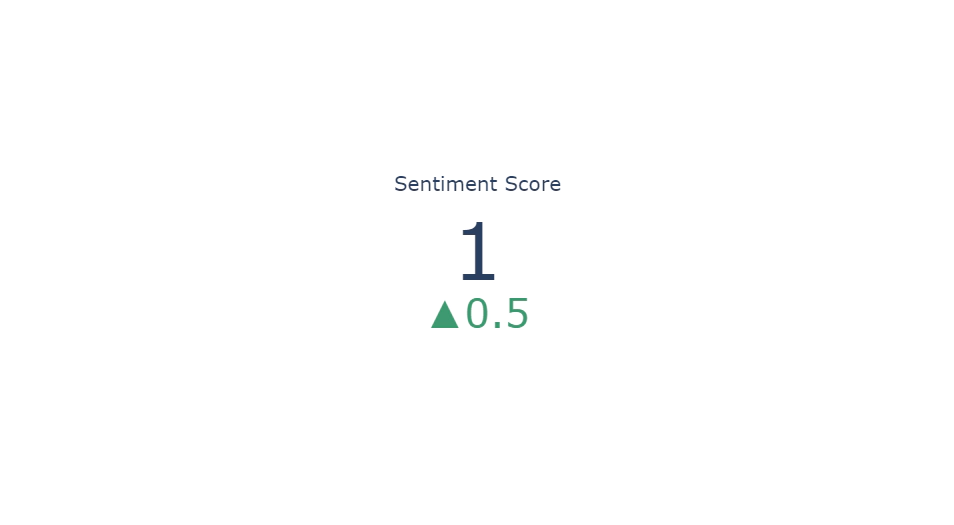
Display sentiment score
We will also plot an indicator that will signify if we have more positive or negative responses. We will calculate the sentiment score as shown in the below code block and analyze the indicator.
# calculate sentiment ratio
sentiment_ratio = df['sentiment'].value_counts(normalize=True).to_dict()
for key in ['negative', 'neutral', 'positive']:
    if key not in sentiment_ratio:
        sentiment_ratio[key] = 0.0

## Display sentiment score
sentiment_score = (sentiment_ratio['neutral'] + sentiment_ratio['positive']) - sentiment_ratio['negative']

fig = go.Figure(go.Indicator(
    mode = "number+delta",
    value = sentiment_score,
    delta = {"reference": 0.5},
    title = {"text": "Sentiment Score"},))

fig.show()
The up arrow signifies a positive indication, whereas the negative indication will be represented through the down indicator.

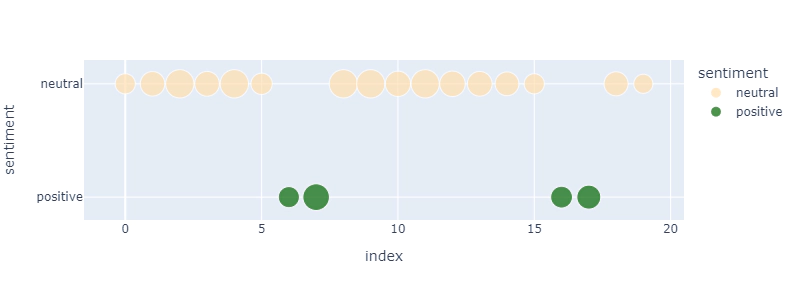
Display sentence locations
Now with the help of scatter plot we can show the sentiments timeline, please see the output below:
## Display negative sentence locations
fig = px.scatter(df, y='sentiment', color='sentiment', size='confidence', hover_data=['content'], color_discrete_map={"negative":"firebrick","neutral":"navajowhite","positive":"darkgreen"})


fig.update_layout(
    width=800,
    height=300,
)

Let’s put it all together
To put it all together, I have developed an interactive app using Streamlit. I would recommend checking out the link here that covers the entire code and the requirements that are necessary to successfully deploy this app.
Deploy an app
Now that we have created our data app, and ready to share it! We can use Streamlit Cloud to deploy and share our app. Streamlit Cloud has multiple tiers, the free Community tier is the perfect solution if your app is hosted in a public GitHub repo and you’d like anyone in the world to be able to access it.
You can check steps to deploy apps with the free Community tier here.
Now my app is live and you can interact with it here.
Conclusion
Thank you for reading! I hope that this project walkthrough inspires you to create your own sentiment analysis model.
Happy Coding!
Releted Posts
Improving Business Processes using Machine Learning
Imagine your business has a contact form on its website. Every day you get many messages from the form, many of which are actionable, but it’s easy to fall behind on dealing with them since different employees handle different queries.
Read moreTime Series Forecasting using Facebook Prophet
Forecasting with time series models can be used by businesses for many purposes, for example, to optimise sales, improve supply chain planning and many other.
Read moreBuild a CRUD App in React
In this article, We’ll walk step-by-step through the process of building out a simple React CRUD app with Web API. It will have tasks, we’ll be able to add, update, list or delete tasks.
Read more

